Subscription Management
What is SaaS analytics, and why is it important? Read on to find that and learn how to use it and which metrics to track for your SaaS business.

|
Quick Summary SaaS analytics helps you understand how your business is performing. This guide explains what SaaS analytics is, why it matters, and which metrics you should track. You'll also learn about popular analytics tools and how to choose the right one for your business. |
Jump to read
What Is SaaS Analytics?
Why Does SaaS Analytics Matter for B2B SaaS and Fintech?
Quick Summary: What are the Key SaaS Metrics At a Glance?
What are the 19 Key B2B SaaS Metrics You Should Track?
Revenue and Financial Metrics
Customer Acquisition & Marketing Metrics
Product and Engagement Metrics
Customer Success and Retention Metrics
What Are the Top SaaS Analytics Tools?
How to Choose a SaaS Analytics Platform
FAQ
Ready to Leverage SaaS Analytics for Business Growth?
SaaS analytics is how advanced B2B SaaS and Fintech teams turn subscription data into decisions. Recurring revenue, churn, contract value, and product usage all become operational signals.
Done well, it gives finance teams a single source of truth for forecasting. Product teams see which features earn renewals. Sales and customer success teams get a real-time read on account health.
This guide covers what SaaS analytics is and why it matters. It walks you through 19 metrics to track across revenue, product, marketing, and customer success. You’ll also find the best analytics tools and a guide to choosing the right one.
What Is SaaS Analytics?
SaaS analytics is the practice of measuring customer behavior, product usage, and recurring revenue performance to drive business decisions. It pulls subscription data into the dashboards that finance, product, and customer success teams rely on daily. Think MRR, churn, contract value, product usage, and customer health, all in one place.
SaaS analytics also help you understand and evaluate how customers use your SaaS product and how satisfied they are with your products and services.
It involves collecting, analyzing, and drawing insights from all the subscription data generated by your SaaS business.
This includes product usage, revenue data, accounts, churn rate, retention, and more.
At the scale advanced B2B SaaS and Fintech companies operate at, you need a specialized SaaS analytics platform.
Spreadsheets and manual rollups break past a few hundred subscribers. They cannot keep pace with multi-entity, multi-currency, or hybrid growth motions.
We recommend a comprehensive subscription management solution with built-in SaaS analytics to eliminate tedious manual tasks and boost efficiency.
Younium is one such platform. It is built for advanced B2B SaaS and Fintech teams across the entire quote-to-cash flow.
Also Read:
- What Is Revenue Leakage (Plus How to Identify and Prevent It)
- AI in Subscription Management: What It Is and Why It Matters
Why Does SaaS Analytics Matter for B2B SaaS and Fintech?
SaaS analytics matters because B2B SaaS and Fintech businesses run on recurring revenue. And recurring revenue runs on customer behavior.
The right platform tracks the subscription metrics that drive forecasts. It predicts churn risk before and gives finance, product, sales, and customer success teams one unified view.
SaaS analytics lets you track key subscription business metrics and evaluate performance across the dimensions that matter most. Here are the most important benefits.
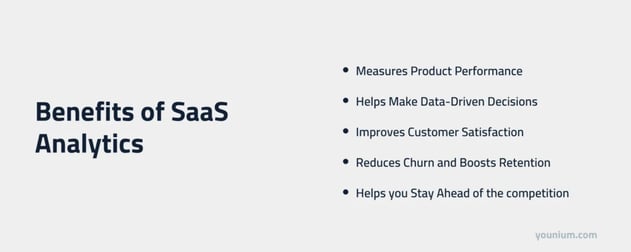
Measures Product Performance
For advanced B2B SaaS and Fintech businesses, keeping the product best-in-class is a key distinguishing factor. As such, B2B SaaS businesses take product innovation and development very seriously, and SaaS analytics helps with that.
With SaaS analytics, you can identify UX issues, feature gaps, and integration friction before they show up in the revenue line.
Helps Make Data-Driven Decisions
SaaS analytics provides insight into revenue growth, customer satisfaction, product usage, and contract performance.
These signals drive decisions from streamlining financial processes to cash flow management. A reliable platform gives you accurate, real-time data to back these decisions.
Improves Customer Satisfaction
SaaS analytics helps you identify issues with your product or service. You can use these insights to improve your services and deliver a better customer experience.
For example, if most of your customers struggle to use your SaaS product to its full potential because of a clunky UI, then you can improve it to resolve that issue. This will help customers use your SaaS product effectively and have a great experience.
That improves satisfaction and encourages renewal.
Reduces Churn and Boosts Retention
SaaS analytics is essential to churn analysis, one of the most critical processes in any subscription business.
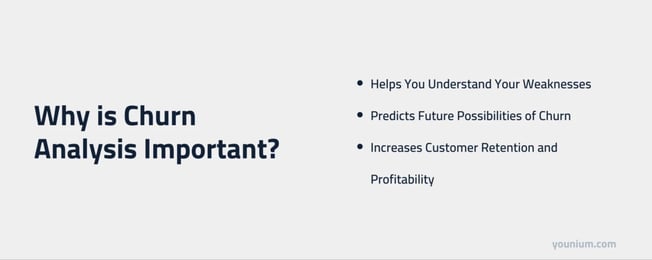
It tracks customer and revenue churn so you can address the causes proactively. It also identifies at-risk customers via product and feature usage. That gives you the window to run retention plays and reduce churn before it hits the quarter.
Helps You Stay Ahead of the Competition
With more B2B SaaS and Fintech businesses launching in every niche, staying ahead is critical. SaaS analytics helps you proactively identify and fix issues, enhancing the customer experience.
By regularly monitoring key subscription metrics and resolving issues, you keep the product consistently superior to what rivals offer. This, in turn, improves customer retention.
|
Key Takeaways: Why SaaS Analytics Matter Good SaaS analytics helps you answer important questions:
The answers help improve both customer retention and business results. |
Also Read:
Quick Summary: What are the Key SaaS Metrics At a Glance?
Here is a quick comparison of 19 key metrics you should track to grow your SaaS business.
|
# |
Metric |
Category |
Formula (or signal) |
What It Tells You |
Cadence |
|
1 |
MRR, ARR, NRR |
Revenue |
Sum of recurring revenue (monthly/annual /net of expansion + contraction) |
Run-rate revenue, health, and expansion or contraction dynamics |
Monthly |
|
2 |
CMRR |
Revenue |
Contracts × avg monthly revenue per contract |
Contractually committed revenue |
Monthly |
|
3 |
ARPA |
Revenue |
Total revenue ÷ number of accounts |
Average account value; upsell trajectory |
Monthly |
|
4 |
ACV |
Revenue |
Booking value over one year |
New-booking revenue commitment |
Per booking |
|
5 |
CAC |
Acquisition |
Sales + marketing spend ÷ new customers |
Cost-efficiency of acquisition |
Monthly |
|
6 |
Payback period |
Acquisition |
CAC ÷ MRR per customer |
Months to recover CAC |
Quarterly |
|
7 |
CLV / LTV |
Acquisition |
Annual revenue per user × avg lifetime (years) |
Customer profitability over the relationship |
Annual |
|
8 |
LTV : CAC ratio |
Acquisition |
LTV ÷ CAC |
Sustainable-growth signal (target ≥ 3:1) |
Quarterly |
|
9 |
Magic Number |
Acquisition |
Net new revenue ÷ S&M spend |
Sales-and-marketing efficiency |
Quarterly |
|
10 |
Time to Value (TTV) |
Product |
Time from onboarding to first value milestone |
Onboarding effectiveness; early-churn risk |
Per cohort |
|
11 |
Adoption Rate |
Product |
% of customers using a new feature |
Feature usefulness: PMF signal |
Per release |
|
12 |
Active Users (DAU/WAU/MAU) |
Product |
Unique users in the period |
Product stickiness |
Daily/weekly /monthly |
|
13 |
Feature Usage Rate |
Product |
Feature users ÷ total users |
Which features drive value |
Monthly |
|
14 |
Avg Sessions Per Day |
Product |
Total sessions ÷ days |
Engagement intensity |
Daily |
|
15 |
Customer Churn Rate |
Retention |
Customers lost ÷ customers at period start |
Logo retention |
Monthly |
|
16 |
Revenue Churn Rate |
Retention |
Revenue lost ÷ revenue at period start |
Dollar retention |
Monthly |
|
17 |
Customer Retention Rate |
Retention |
(End customers − new) ÷ start customers |
Logo retention (inverse of churn) |
Annual |
|
18 |
NPS |
Retention |
% promoters − % detractors |
Customer loyalty |
Quarterly |
|
19 |
CSAT |
Retention |
(Satisfied responses ÷ total) × 100 |
Day-to-day satisfaction |
Per touchpoint |
What are the 19 Key B2B SaaS Metrics You Should Track?
Every SaaS business must track essential revenue growth metrics like MRR and ARR, and customer success metrics like NPS. If you spend heavily on marketing, then tracking CAC, Payback period, and CLV is also crucial. Lastly, product engagement metrics help you improve your offerings and boost retention.
Here are the top metrics you should track, by category.
Revenue and Financial Metrics
These are the metrics that finance and the board care about the most. For advanced B2B SaaS and Fintech with multi-entity rollups or multi-currency operations, getting these right matters. It is as much about audit readiness as it is about growth.
1. Monthly, Annual, and Net Recurring Revenue (MRR, ARR, NRR)
Recurring revenue is one of the essential B2B SaaS metrics every business should track. It predicts the steady revenue stream from clients within a period.
As is evident, Monthly Recurring Revenue (MRR) calculates this for a month, while Annual Recurring Revenue (ARR) calculates this for a year.
You can calculate MRR in two ways:
- Sum the revenue from all customers in a month, excluding one-time charges.
- Calculate Average Revenue Per Account (ARPA) and multiply by the number of accounts.
To calculate ARR, you can either multiply MRR by 12 or add MRR for all 12 months.
The third metric is net recurring revenue (NRR). Unlike MRR, NRR factors in revenue expansion and contraction within the period.

Using a good SaaS analytics tool helps with these calculations, so you don’t have to do it manually.
2. Contracted Monthly Recurring Revenue
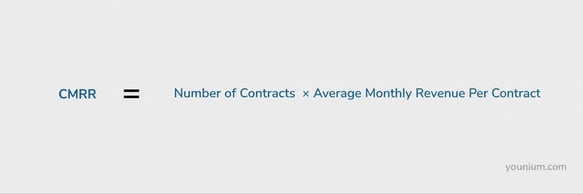
CMRR is the expected revenue from a new contract or a change to an existing one. It differs from MRR because MRR factors in fluctuations from churn or upsells; CMRR only counts what your company is contractually obligated to receive in a month.
CMRR = Number of Contracts × Average Monthly Revenue Per Contract
3. Average Revenue Per Account (ARPA)
This SaaS analytics metric measures the average revenue generated by a typical client account for your subscription business within a given period.
The goal for every B2B SaaS and Fintech business is to increase ARPA. That is how you boost and sustain revenue. A higher ARPA indicates clients are opting for higher-tier plans on average.
Calculate ARPA separately for new and existing clients to identify SaaS trends. It also helps in the MRR calculation.
4. Annual Contract Value (ACV)
This SaaS analytics metric is similar to CMRR but considers an annual time period. You can calculate ACV using the booking values of customer contracts. It measures how much revenue a new booking will generate in a year.
Like CMRR, ACV considers contract value rather than monthly fluctuations. It stays constant unless contract terms change.
Tracking bookings, CMRR, and ACV manually is unsustainable past a certain scale. An efficient subscription management and SaaS analytics platform like Younium makes it simple.
Also Read:
Customer Acquisition & Marketing Metrics
These are the SaaS analytics that metrics RevOps, marketing, and growth lean on. Advanced B2B SaaS and Fintech have long sales cycles. The payback math decides whether the growth motion is sustainable.
5. Customer Acquisition Cost (CAC)
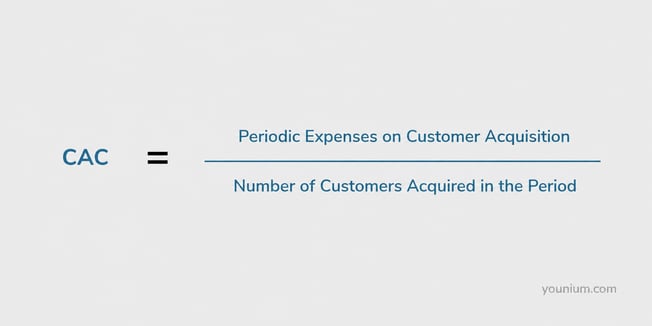
This measures your company's total cost of winning a new customer or account. This includes all your marketing, advertising, and sales expenses in the pursuit of winning new customers.
CAC = Periodic Expenses on Customer Acquisition ÷ Number of Customers Acquired in the Period
Why does it matter?
This gives you an idea of how much you’re spending on acquiring new customers and if it’s worth the benefit you’re getting. A high CAC is bad for your SaaS business and you need to take immediate action to reduce it.
This could involve creating more targeted, high-converting marketing campaigns, optimizing your sales process, or improving lead qualification. You could also focus more on customer retention to get more benefits from the customers that you acquire.
As such, CAC should not be measured in a silo and should be considered alongside other SaaS metrics, such as customer lifetime value (CLTV) and payback period. We’ll discuss these metrics next.
6. Payback Period
Payback period measures how long it takes to recover the cost of acquiring a new customer.
Payback Period = CAC ÷ MRR from a Customer
Say you spend $1,000 acquiring a customer. On a $100/month plan, payback is 10 months. On a $200/month plan, payback is 5 months.
Advanced B2B SaaS and Fintech businesses compete for enterprise contracts and expand within accounts to shorten payback periods. If a customer churns before payback, the entire CAC is sunk. That is why the next two SaaS analytics metrics matter.
7. Customer Lifetime Value (CLV or LTV)
CLV is the total revenue a customer generates on average. Tracking it individually is tedious, so businesses track the average. A good SaaS analytics platform automates it and strengthens overall BI.
LTV = Annual Revenue Per User × Average Customer Lifetime in Years
LTV helps you:
- Assess marketing and retention effectiveness
- Measure segment profitability
- Set marketing budgets
- Segment customers by value
Overall, LTV is an important metric you should track using SaaS analytics tools. It will guide your strategic business decisions and help you improve your marketing and customer retention efforts.
8. LTV: CAC Ratio
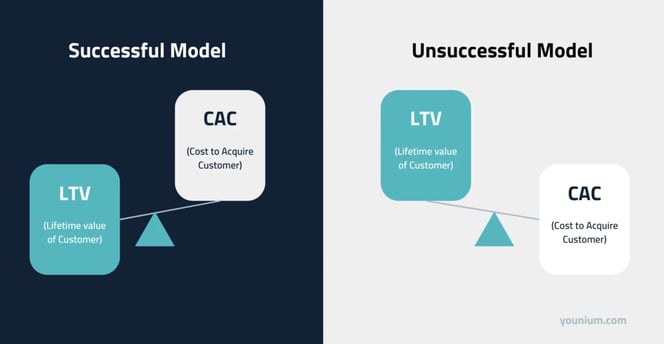
CAC and LTV become genuinely useful together. The ratio reveals whether marketing drives sustainable revenue growth.
So, how does it work?
Well, let’s consider you spend $1000 on acquiring a new customer and generate a revenue of $1000 over the customer’s lifetime. Yes, it’s not a loss, but you also gain nothing.
Ideally, you should opt for a ratio higher than 3:1, because then you’ll gain more from a customer than what you spent on winning them over. Of course, the higher your LTV, the more profitable your marketing efforts will be, and you’ll get a higher return on investment.
Here’s a visual that explains the concept.
Also Read:
- Essential Subscription Business Metrics To Track
- Streamlining Financial Processes with Subscription Billing
9. Magic Number
This is a SaaS analytics metric that measures the efficiency of your marketing and sales efforts. It basically calculates the return on investment on your sales and marketing spend.
Magic Number = Revenue Growth in a Period ÷ Sales and Marketing Expenses During the Period
A high number shows that your sales and marketing efforts are effectively generating subscription revenue and driving business growth, and vice versa.
If you have a low magic number, you need to streamline your sales and marketing processes and make them more targeted.
Product and Engagement Metrics
The SaaS analytics metrics are important for product and engineering teams. For PLG-leaning B2B SaaS and Fintech, these are the leading indicators of revenue churn.
10. Time to Value (TTV)
TTV is the time it takes a new customer to experience the value your software promises after onboarding. It’s one of the key B2B SaaS analytics metrics and provides insights into your onboarding efficiency, customer experience, and product's effectiveness.
A shorter TTV means your customers are reaching productivity quickly, which can accelerate your sales cycles, increase subscription renewal rates, and maximize ROI. On the other hand, if your customers don't experience value quickly, they might get frustrated and churn.
Tracking TTV can help you identify and fix product and onboarding inefficiencies and ultimately improve the customer experience. To calculate this SaaS analytics metric, you’ll need to define what "value" means for your product and set clear milestones. Once done, track the time it takes for each new customer to reach that point.
For instance, if your SaaS product helps HR teams automate hiring, your TTV could be the time between creating an account and successfully scheduling a job interview using your tool.
11. Adoption Rate
Adoption Rate measures how effective a newly launched feature is and how much customers use it. It is the share of customers using a particular feature.
You need a SaaS analytics platform or a subscription management solution with built-in analytics to track this properly.
This metric helps you assess the usability and usefulness of product features and supports more informed product development decisions in the long run.
If a feature barely gets used, it is either not useful or needs improvement.
12. Active Users
Just like the adoption rate measures the usefulness of new features, this metric assesses the effectiveness of your overall SaaS product.
You can track three different metrics for this — daily active users (DAU), weekly active users (WAU), and monthly active users (MAU). To calculate these SaaS analytics metrics, find the number of unique users in the set period.
Now, let’s discuss why this SaaS analytics metric is so important.
- If several of your customers are not actively using your product, then that may indicate a product or usability issue that you should fix.
- This metric also helps with churn analysis. Customers who’ve stopped using your product or are not using it actively are likely to churn. This metric helps you identify at-risk customers, so you can proactively take action to retain them.
You can also use this metric to find your most loyal customers, who love your product and use it actively throughout the month. This helps you with segmenting your customers for marketing communications.
Overall, it’s important for every SaaS business to track its active users using a good SaaS analytics platform, as it provides invaluable insights. We recommend you invest in a B2B subscription management hub that provides in-depth analytics.
13. Feature Usage Rate
This may seem very similar to the adoption rate metric discussed above, but there’s a slight difference. Unlike the adoption rate, which measures the adoption of a new feature, this one measures the frequency with which customers use existing features.
It’s great for assessing which features are popular among customers and which ones they don’t find useful.
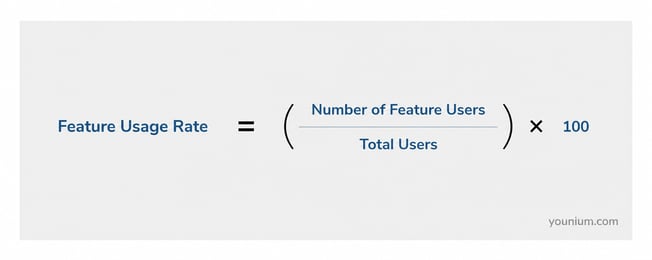
Feature Usage Rate = (Number of Feature Users ÷ Total Users) × 100
Identifying top- and low-performing features supports ongoing product enhancement. This subscription metric belongs on the dashboard.
14. Average Sessions Per Day
Average Sessions Per Day is a SaaS analytics metric that measures the average number of times customers interact with your platform each day. A session starts when a customer logs into your platform and ends after a period of inactivity or when the user logs out.
Average Sessions Per Day = Total Sessions in Period ÷ Number of Days in Period
It’s one of the most crucial B2B SaaS analytics metrics that help you assess:
- Product stickiness
- User engagement trends
- Adoption success
- Feature usage
Frequent sessions signal customers have wired the product into their workflows. The more ingrained the product, the lower the churn risk.
Sharp drops in session counts could indicate usability issues, bugs, or a disconnect between product value and customer needs.
To increase user engagement, update your platform’s user interface and ensure it consistently provides value to users in their daily tasks. You can also integrate a user engagement platform to gain deeper insights into behavior patterns and enhance retention strategies.
Also Read:
- How B2B SaaS Finance Teams Can Use Technology to Their Advantage
- How to Ace Subscription Management and Accurate Forecasting
Customer Success and Retention Metrics
These are the metrics that matter most for CS teams, but the whole business should watch. In a recurring-revenue model, what you retain matters more than what you acquire.
15. Customer Churn Rate
This is probably one of the most important metrics that all SaaS analytics software solutions must track.
It tracks how many customers stop doing business with you or cancel their subscriptions within a given time period.
Here’s the formula for calculating the customer churn rate.
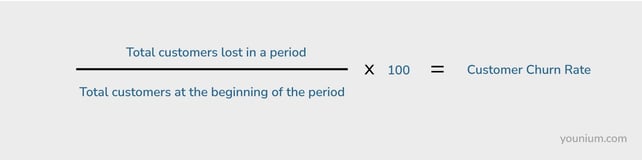
Let’s say you start with 100 customers at the beginning of the period and lose 10 of them over the course of the year. Your customer churn rate will be 10%.
As you can guess, a high customer churn rate is bad for your business. It shows that customers are not satisfied with your product, service, or overall user experience.
If you want to learn more about the different reasons why customers churn, the image below shares a few.
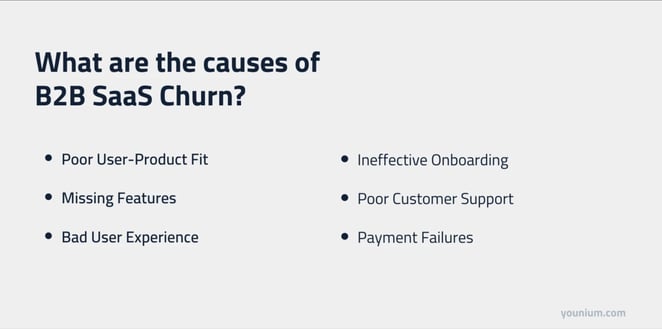
If your customer churn rate is high, find the root cause and fix it to improve customer retention.
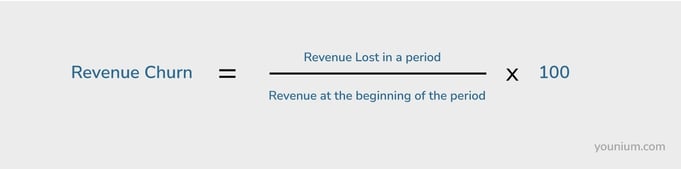
16. Revenue Churn Rate
While customer churn rate is an important SaaS analytics metric, it doesn’t always give you the complete picture. This is because not all customers are equal, and some accounts are more valuable for your SaaS business than others.
For instance, a customer on your most expensive subscription plan and an annual contract is more valuable than a first-time customer who’s trying your basic monthly plan. If you lose the first customer, you’ll lose a lot more revenue than you’ll lose with the latter.
That’s why it's important to calculate revenue churn, alongside customer churn, to get a more holistic view of the situation.
Revenue churn is measured as the revenue lost in a period, and you can calculate it monthly, quarterly, annually, and so on. Here’s the formula to calculate the revenue churn rate.
17. Customer Retention Rate
This metric tracks the number of customers your business was able to retain during a period. You should track this annually, though it is possible to track it more frequently if needed, especially for early-stage startups.
Customer Retention Rate = (Number of Customers at End of Period − Number of New Customers) ÷ Number of Customers at Start of Period
It shows how effective your product is. A poor retention rate also signals weak customer service or experience. Both are worth fixing fast.
18. Net Promoter Score (NPS)
NPS measures customer loyalty by asking them how likely they are to recommend your SaaS product to their friends.
You can do this by sending a short survey where customers can rate their likelihood of recommending your brand on a scale of 1 to 10.
Here’s what this scale looks like:

Image via Gmail
People who rate 9 or 10 are loyal customers who are willing to promote your brand. Those who rate 7 or 8 are considered passive respondents but can be persuaded to become promoters. However, a rating of 6 or below is generally not considered good.
Once you get the responses, you can calculate the score using the formula below.
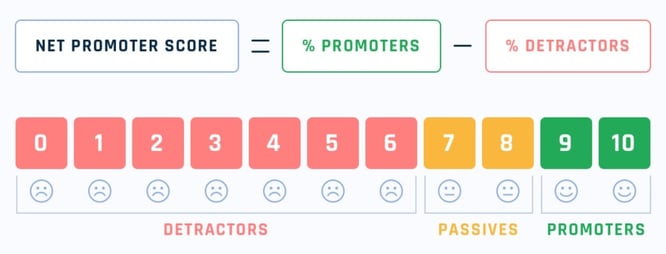
Image via Retently
19. Customer Satisfaction Score (CSAT)
While NPS tests a customer’s likelihood of promoting your brand, CSAT measures how satisfied they are with your product or customer service.
Similar to NPS, you need to send user feedback collection surveys, with a different scale, to calculate this score. It is a five-point scale ranging from extremely dissatisfied to extremely satisfied.
Here’s what the scale looks like, along with the formula for calculating CSAT.
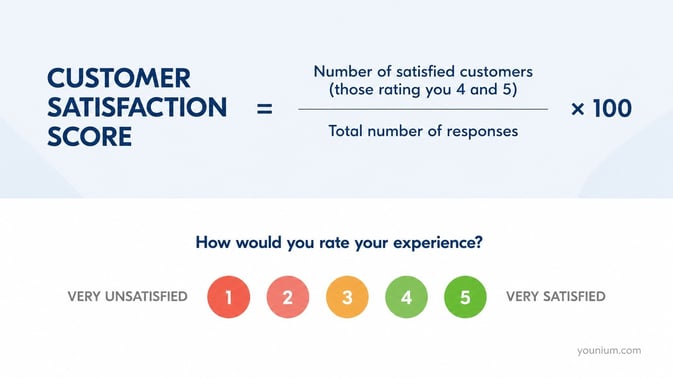
A low CSAT is problematic and indicates that most of your customers are dissatisfied with your product, customer service, or overall experience with your brand. In this case, you need to dig deeper and find the cause of this dissatisfaction and fix it.
This is another SaaS analytics metric that you can use to identify satisfied and dissatisfied customers. This is useful in customer segmentation for various business purposes.
For instance, you could send more detailed feedback collection surveys to dissatisfied customers or ask satisfied customers for referrals.
|
Summary: Key SaaS Analytics Metrics Not every metric serves the same purpose.
Together, they provide a complete view of SaaS business performance. |
Also Read:
- Smart Choices: A Tactical Buyer's Guide for Subscription Management Solutions
- Revolutionizing B2B SaaS: Mastering Usage-Based Pricing Strategies
What Are the Top SaaS Analytics Tools?
The top SaaS analytics tools split into two camps. The first is full subscription management platforms with native analytics, like Younium. The second is lighter self-serve metrics tools like ChartMogul and Baremetrics.
The right choice depends on where your data lives and how complex your contracts are.
- Younium is built for advanced B2B SaaS and Fintech with hybrid growth motions. It combines subscription management, billing, revenue recognition, CPQ, and SaaS analytics in one quote-to-cash system. It is strongest for multi-entity, multi-currency operations where audit-ready financials matter as much as growth dashboards.
- ChartMogul is a self-serve SaaS analytics tool for early- and growth-stage SaaS. It pulls from common billing systems and shows MRR, churn, and cohort trends out of the box. It is light on revenue recognition.
- Baremetrics is a SaaS analytics tool with plug-and-play visibility. It tracks MRR, ARR, LTV, and churn with little configuration. It is SMB-focused. Advanced B2B and Fintech buyers typically outgrow it.
For advanced B2B SaaS or Fintech buyers, the platform call comes down to integration breadth, real-time depth, and revenue-recognition rigor. The How to Choose a SaaS Analytics Platform section below walks through the five criteria.
Also Read:
How to Choose a SaaS Analytics Platform
The right SaaS analytics platform for an advanced B2B SaaS or Fintech business fits your contract complexity and growth motion.
Five criteria separate enterprise-grade tools from SMB metrics dashboards.
- Integration Breadth: Does it connect to CRM, billing, ERP, and product analytics without expensive middleware? For Fintech, payment-processor depth matters as much as CRM.
- Real-Time Dashboards: Does it surface MRR, churn, and contract changes live, or on a daily lag? Boards expect live numbers.
- Revenue-Recognition Depth: Does it generate audit-ready revenue recognition (ASC 606 / IFRS 15) from the same data the dashboards use?
- Native Subscription Billing and CPQ: Is billing, quoting, and contract management built in, or bolted on through fragile integrations? Hybrid sales-led and product-led motions break bolt-ons first.
- Multi-Entity and Multi-Currency Support: Can it roll up across entities and currencies natively? For advanced B2B SaaS and Fintech companies operating globally, this is the single biggest line between "fit" and "outgrew."
Score every shortlisted SaaS analytics tool fairly. The platform that wins on integration depth and revenue-recognition rigor saves you a switch 18 months later.
Also Read:
- Churn Analysis: Definition, Ways to Do it, & How to Monitor it
- How to Improve Subscription Renewal Rates
FAQ
1. What is SaaS analytics?
SaaS analytics refers to the process of tracking and analyzing key performance indicators (KPIs) that measure the success and health of a SaaS business. This includes metrics related to revenue, customer retention, product usage, and financial efficiency. Most modern businesses use SaaS analytics platforms that automate data collection and reporting — turning raw subscription data into actionable insights. These platforms help teams make informed decisions and optimize growth strategies.
2. Is Google Analytics a SaaS analytics platform?
No. Google Analytics is a web analytics tool primarily used to track website performance and user behavior online. While helpful for marketing and traffic insights, it doesn't offer the financial and operational visibility needed for SaaS-specific metrics like MRR, churn, LTV, or customer expansion. For true SaaS performance tracking, businesses need specialized platforms like Younium that are designed to handle subscription billing, revenue recognition, and SaaS KPIs.
3. What is SaaS analytics used for?
SaaS analytics is used to:
- Monitor business performance in real time
- Track recurring revenue and usage trends
- Analyze churn and retention
- Identify growth opportunities and product-adoption patterns
- Enable data-driven decisions across sales, finance, product, and customer success
With the right platform, these insights go far beyond dashboards — they support strategic forecasting, revenue planning, and operational efficiency.
4. Which are the most important SaaS metrics I should track?
The most important SaaS metrics to track include:
- Monthly Recurring Revenue (MRR) and Annual Recurring Revenue (ARR)
- Contracted Monthly Recurring Revenue (CMRR)
- Average Revenue Per Account (ARPA)
- Annual Contract Value (ACV)
- Customer Acquisition Cost (CAC)
- Payback Period
- Customer Lifetime Value (CLV / LTV)
- LTV : CAC Ratio
- Magic Number
- Time to Value (TTV)
- Adoption Rate
- Active Users (DAU / WAU / MAU)
- Feature Usage Rate
- Average Sessions Per Day
- Customer Churn Rate
- Revenue Churn Rate
- Customer Retention Rate
- Net Promoter Score (NPS)
- Customer Satisfaction Score (CSAT)
5. Which software can I use for SaaS analytics?
Few tools support the full SaaS revenue lifecycle. The best fit is usually a subscription management platform with built-in analytics. Younium is one such solution, built for advanced B2B SaaS and Fintech companies. It tracks the full range of SaaS KPIs, offers real-time dashboards, and integrates analytics with billing, quoting, and contract data. It also supports hybrid sales-led (SLG) and product-led (PLG) growth motions.
6. What is Younium?
Younium is a complete quote-to-cash and subscription management platform built for B2B SaaS companies. It unifies CPQ, billing, revenue recognition, and SaaS analytics in one place — giving sales, finance, and customer success a shared system of record. Unlike point solutions or lightweight tools, Younium is finance-grade, audit-ready, and designed to support hybrid growth motions, including Sales-Led (SLG) and Product-Led (PLG). It’s trusted by scaling software businesses to manage complex contracts, recurring revenue, usage-based pricing, and financial reporting — all within one platform.
7. Does Younium offer any AI-powered analytics?
Yes. Younium includes an AI Co-Pilot that delivers intelligent recommendations, surfaces trends, and helps you identify outliers or anomalies in your revenue data. It enhances your analytics with predictive insights and allows business users to get answers fast — without needing SQL or complex configuration.
8. What are the most popular SaaS analytics platforms?
Some of the most widely used SaaS analytics platforms include:
- Younium – Best for B2B SaaS with complex revenue models and full quote-to-cash automation
- ChartMogul – Focused on self-serve metrics and integrations for startups
- Baremetrics – User-friendly dashboards for small SaaS teams
Younium stands out by offering complete revenue operations, fully integrated with billing, contracts, amendments, and compliance, rather than analytics alone.
9. What's the difference between SaaS analytics and product analytics?
SaaS analytics measures financial and operational health. That covers recurring revenue, churn, retention, LTV, and contract value. Product analytics measures how users interact with the product itself. That covers feature usage, session depth, funnels, and in-product drop-off.
SaaS analytics tells you whether the business is healthy. Product analytics tells you why users behave the way they do. Advanced B2B SaaS and Fintech teams need both, ideally unified.
10. How often should I review my SaaS analytics dashboard?
Cadence depends on the metric. Revenue and churn metrics should be reviewed monthly at close. Acquisition metrics (CAC, payback, LTV:CAC, magic number) should be reviewed quarterly.
Product metrics belong on a live dashboard checked daily or weekly. NPS and CSAT should be reviewed in each survey wave. A good SaaS analytics platform automatically tracks and analyzes all of these.
11. Which SaaS analytics metrics do investors care about most?
For advanced B2B SaaS and Fintech raising capital, investors lean on a specific set. ARR growth rate, Net revenue retention, CAC, payback period, and LTV: CAC are the crucial ones.
Ready to Leverage SaaS Analytics for Business Growth?
SaaS analytics gives advanced B2B SaaS and Fintech teams a single read on subscription performance. That includes revenue health, churn risk, product engagement, contract value, and marketing efficiency.
The 19 metrics in this guide cover all aspects of a SaaS business.
For teams running multi-entity, multi-currency, or hybrid growth motions, the platform decision matters as much as the metrics. Younium provides the reliable subscription management and SaaS analytics layer built for that scale.
It gives you one source of truth for subscription management, revenue recognition, and reporting. To see how it works, request a demo.