Subscription Management
Forecasting subscription revenue, made practical: the models, metrics, and tips B2B SaaS finance teams use to predict recurring revenue with confidence.

Jump to read
What is Subscription Revenue Forecasting?
Why Does Accurate Forecasting Matter for B2B SaaS and Fintech?
What Are the Main Subscription Revenue Forecasting Models?
Which Metrics Power a Subscription Revenue Forecast?
How Do You Forecast Subscription Revenue Step by Step?
What Factors Affect Subscription Revenue Forecast Accuracy?
What Are the Common Pitfalls in Subscription Revenue Forecasting?
How to Choose the Right Forecasting Approach and Tools
FAQ
Wrapping Up
|
Quick summary. Forecasting subscription revenue means projecting the recurring revenue your subscription base will generate over a set period. This guide breaks down:
It ends with guidance on choosing the right approach for an advanced B2B SaaS or fintech finance team. |
Forecasting subscription revenue is one of the hardest numbers for B2B SaaS or fintech finance teams to get right consistently and accurately. Recurring revenue may look predictable on the surface, but underneath, churn, expansion, contraction, usage-based pricing, and mid-term contract adjustments can pull the forecast in several directions at once.
And as SaaS companies grow faster, those variables become even harder to account for. According to KeyBanc Capital Markets' private SaaS survey, year-over-year ARR growth increased from 15% in 2024 to 20% in 2025. That acceleration raises the cost of getting the forecast wrong, because the faster revenue changes, the more quickly weaknesses in the model compound.
That makes a reliable forecasting framework increasingly important. This guide covers the forecasting models available, the metrics that feed them, a step-by-step method for building a forecast, and the practical factors that improve accuracy in real-world SaaS and fintech environments.
What Is Subscription Revenue Forecasting?
Subscription revenue forecasting is the process of estimating the recurring revenue your business will earn over a defined period, usually monthly, quarterly, or annually. It works by modeling key revenue drivers such as new customer acquisition, churn, and expansion to project future MRR and ARR.
This helps turn your subscription data into a forward view of revenue. It draws on recurring revenue, active customer counts, churn, retention, and contract changes. For any subscription-based business, a reliable forecast underpins budgeting, hiring, and fundraising.
Recurring revenue is harder to forecast than it looks. A single contract can shift mid-term through an upgrade, a downgrade, or a usage spike. Multiply that across hundreds of accounts, and the variables compound fast, with small changes in individual contracts significantly impacting overall revenue predictability.
That is why most teams move beyond spreadsheets to a structured subscription revenue model and a dedicated platform. The cleaner your recurring revenue data, the more accurate every forecast that follows.
Why Does Accurate Forecasting Matter for B2B SaaS and Fintech?
Accurate forecasting matters because B2B SaaS and fintech businesses rely on recurring revenue, and that revenue depends on customer behavior. A reliable forecast guides budgets, hiring, and fundraising. A weak one misprices runway and erodes board trust.
This makes the revenue forecast the backbone of your financial planning. It tells you how much cash is coming and how confidently you can spend against it based on expected recurring revenue performance.
Retention is the biggest lever on that accuracy. SaaS Capital's 2025 research found that net revenue retention was one of the strongest predictors of growth across a cohort whose median growth rate was 24%. In other words, your retention assumptions move the forecast more than almost anything else, as they directly affect the stability of long-term revenue.
Here is where a good forecast pays off:
- Fundraising and investor reporting. Investors expect a defensible forecast and the right metrics to back it up.
- Cash flow and runway. A forecast is the input to cash flow management and hiring plans.
- Board and strategic decisions. Leadership needs a credible number to brief the board.
What Are the Main Subscription Revenue Forecasting Models?
The main forecasting models are top-down, bottom-up, cohort-based, and driver-based. Top-down starts from market size. Bottom-up builds from your customer base. Cohort models track retention curves. Driver-based ties revenue to operational inputs such as pricing, churn, and expansion drivers.
The right choice depends on your stage, data quality, and contract complexity. The table below compares the four models before we look at each one in detail.
|
Model |
How It Works |
Best For |
Data Needed |
Main Limitation |
|
Top-Down |
Start from market size, then take a realistic share |
Board narrative, early stage, new markets |
TAM/SAM, target market share |
Optimistic; weak operational grounding |
|
Bottom-Up |
Build from customers × ARPA, then layer new, churn, and expansion |
Operating plans; most SaaS forecasts |
Customer counts, ARPA, churn, pipeline |
Needs clean subscription data |
|
Cohort-Based |
Model each cohort's retention and expansion curve over time from acquisition onward |
Variable churn across the lifecycle; PLG and usage models |
Cohort retention curves, historical churn |
Data-intensive; needs history |
|
Driver-Based |
Tie revenue to operational drivers like pipeline, seats, or usage metrics |
Scenario planning and what-if analysis |
Conversion rates, seat or usage drivers |
Complexity grows quickly as more operational drivers and scenarios are added |
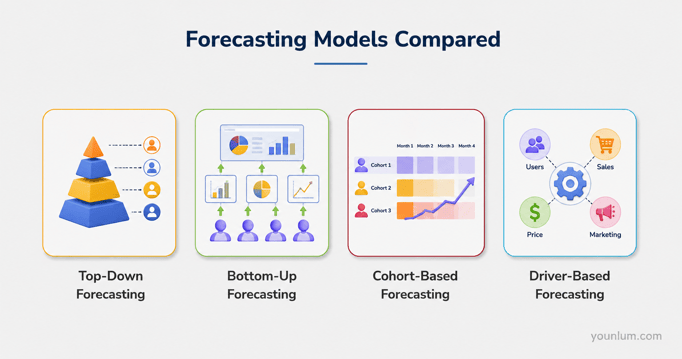
For most operating SaaS teams, bottom-up is the default: it builds from real customer and ARPA data, while top-down suits early-stage or new-market estimates.
Top-Down Forecasting
Top-down forecasting estimates your total addressable market, then applies a realistic market-share assumption to set a revenue target.
It is fast and useful for a broad story or a new market with little history. The weakness is rigor. Top-down numbers are easy to inflate and rarely survive contact with your actual pipeline.
Bottom-Up Forecasting
Bottom-up forecasting builds from your current customer base and ARPA, then layers in new customers, churn, and expansion month by month. It’s the default model for most subscription businesses.
It grounds the forecast in real operating data, so it is far harder to misrepresent or overstate. The catch is data quality. Bottom-up only works when your subscription, billing, and contract data are clean and up to date.
Cohort-Based Forecasting
Cohort-based forecasting groups customers by when they signed up, then projects each cohort's retention and expansion separately. It captures a reality that simple models miss. Churn is rarely flat across the customer lifecycle.
This approach shines for product-led and usage-based businesses, where early behavior predicts long-term value more reliably than static averages. It leans on churn analysis and needs enough history to build reliable curves.
Driver-Based Forecasting
Driver-based forecasting links revenue to the operational inputs that create it, such as pipeline, conversion rates, seats, or usage-based consumption.
It is the strongest model for scenario planning and what-if analysis. The trade-off is complexity, which is why driver-based models usually live in a platform rather than a spreadsheet. For a quick baseline, run-rate forecasting annualizes current MRR (MRR × 12). It is fast, but it ignores churn, seasonality, and expansion, so treat it as a sanity check, not a forecast plan.
Also Read:
- How to Create a Subscription Revenue Model Template
- Essential Subscription Business Metrics to Track
Which Metrics Power a Subscription Revenue Forecast?
A subscription revenue forecast is based on a core set of metrics: MRR and ARR for run rate, NRR for expansion, customer churn rate for losses, ARPA (also called ARPU) for account value, and CLV for lifetime value. Together, they turn customer counts into a revenue projection by translating retention, expansion, and pricing behavior into forward-looking revenue.
Every forecasting model leans on the same handful of subscription metrics to structure and validate revenue assumptions. The table below summarizes them before we work through each one.
|
Metric |
Formula |
What It Tells You |
|
MRR / ARR |
Active customers × ARPA (monthly) (approx.); ARR = MRR × 12 |
Baseline recurring revenue run-rate |
|
NRR |
(Start MRR + expansion − contraction − churn) ÷ Start MRR |
Whether your base grows without new logos |
|
Customer Churn Rate |
Customers lost ÷ customers at period start × 100 |
How fast you are losing customers |
|
ARPA |
Total MRR ÷ active accounts |
Average value per account; upsell trajectory |
|
CLV |
ARPA ÷ churn rate |
Total revenue per customer over their lifetime |
Of these, net revenue retention and churn move the forecast most: small retention changes compound across the whole customer base.
Average Monthly Recurring Revenue (MRR & ARR)
Average MRR is the estimated recurring revenue a subscription business expects in a given month. You calculate it by multiplying active customers by Average Revenue Per Account (ARPA). It is the baseline every forecast builds on.
For example, if 30 customers each pay $100 per month, your average MRR is $100 × 30 = $3,000. To get ARR, multiply MRR by 12.

Net Revenue Retention (NRR)
Net revenue retention measures how much recurring revenue you keep and grow from existing customers, including the effects of expansion, contraction, and churn. It is the single best signal of whether your base compounds on its own.
It matters because expansion can offset churn entirely. SaaS Capital's 2025 research put median NRR at 102% for companies with $25,000–$50,000 ACV, with the top quartile at 111%. Above 100% means your existing base grows even before you add a single new logo. Track net recurring revenue closely, because it drives the expansion line in any credible forecast.
Customer Churn Rate (CCR)
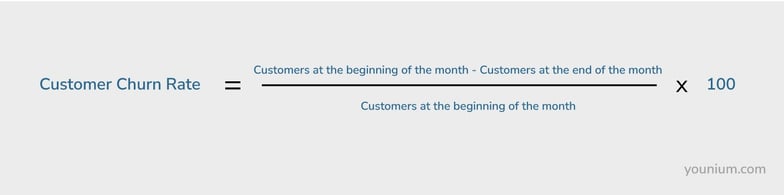
The customer churn rate shows how many customers you lose over a month or a year, and in a forecast, it sets how fast the customer base decays, driving projected customer lifetime and CLV. Divide the customers lost in a period by the customers at the start, then multiply by 100.
Churn is a moving target you have to both track and predict, not just measure. For context, KeyBanc's private SaaS survey reported gross retention declining to 86% in 2023, which implies roughly 14% gross revenue churn, before recovering toward 90%.
This shows how volatile retention trends can be, which directly impacts churn assumptions in forecasting models. To forecast churn well, you need a forward read on customer behavior, which a dedicated SaaS analytics platform makes far easier.
Average Revenue Per Account (ARPA)
ARPA is the revenue-generating power of a typical account, calculated by dividing total revenue by the number of accounts. It's essential for any per-customer forecast.
Calculate ARPA by dividing total MRR by the number of active customers in a month. Tracking it separately for new and existing accounts helps you spot trends early.
Customer Lifetime Value (CLV)
Customer lifetime value is the total revenue a customer generates across their relationship with you. To calculate it, you need your retention rate and your monthly customer churn rate.
A simple formula is CLV = ARPA ÷ churn rate. The lower your churn, the higher each customer's lifetime value, and the stronger your long-term forecast.

Also Read:
- Revenue Growth Management: What It Is and Why It’s Important
- Subscription Metrics Part 2: Difference between MRR & CMRR?
How Do You Forecast Subscription Revenue Step by Step?
Forecasting subscription revenue is a four-step bottom-up model:
- Calculate your customer base.
- Multiply it by ARPA to get MRR.
- Apply your churn rate to project the customer count over time.
- Then derive lifetime value and annual recurring revenue.
If you use a subscription management platform with built-in forecasting, most of this runs automatically. If you are still in spreadsheets, here is the manual method, with a worked example.
Step 1. Calculate Your Customer Base
First, build a continuity schedule for your customers. For each month, your customer base is "customers at the start of the period + new customers − cancellations." Three revenue streams feed it: existing customers, new customers, and future renewals.
Step 2. Multiply the Customer Base by ARPA
Multiply your revenue-generating customer base by ARPA to get monthly recurring revenue. This MRR serves as the baseline for sales, marketing, and finance planning, as well as for future predictions.
Step 3. Calculate Churn Rate
Using the data from Step 1, divide each month's cancellations by the customers at the start of that month. The result is your churn rate. It also gives you the projected customer lifetime: 1 ÷ churn rate. At 10% monthly churn, the projected lifetime is 1 ÷ 0.10 = 10 months.
Step 4. Determine Lifetime Value and Forecast ARR
With the projected lifetime in hand, calculate Average Customer Lifetime Value (ACLV) as ARPA ÷ churn rate. Then multiply monthly MRR by 12 for an ARR forecast. The worked example below shows the full build across three months.
|
Row |
|
Month 1 |
Month 2 |
Month 3 |
|
A |
Customers (start of month) |
80 |
272 |
442 |
|
B |
New customers |
200 |
200 |
200 |
|
C |
Subscription cancellations |
8 |
30 |
60 |
|
D |
Customers (end of month) (A+B−C) |
272 |
442 |
582 |
|
E |
Customer base for revenue (A+B) |
280 |
472 |
642 |
|
F |
ARPA |
$100 |
$100 |
$100 |
|
G |
MRR (E×F) |
$28,000 |
$47,200 |
$64,200 |
|
H |
Customer churn rate [100×(C÷A)] |
10% |
11% |
14% |
|
I |
Projected lifetime in months (1÷H) |
10 |
9.09 |
7.14 |
|
J |
CLV (F÷H) |
$1,000 |
$909 |
$714 |
|
K |
ARR (G×12) |
$336,000 |
$566,400 |
$770,400 |
In this worked example, churn climbing from 10% to 14% over three months shortens the projected customer lifetime from 10 months to roughly 7.
This manual model works, but it breaks down at scale. Mid-term upgrades, downgrades, and usage charges are hard to track by hand, and spreadsheet errors creep in. A platform with built-in revenue forecasting removes the manual work and keeps the numbers current.
Also Read:
- How to Ace Subscription Management and Revenue Forecasting
- Subscription Management Tools B2B Finance Teams Should Know
What Factors Affect Subscription Revenue Forecast Accuracy?
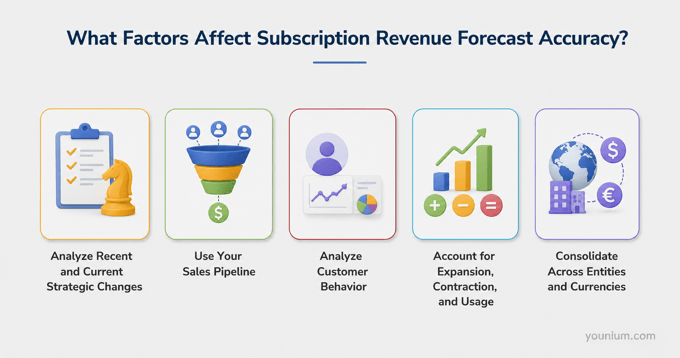
Forecast accuracy depends on recent strategic changes, your sales pipeline, customer behavior, expansion and usage dynamics, and how cleanly you consolidate across entities and currencies. Each factor shifts the assumptions behind your numbers.
A forecast is only as good as the assumptions behind it. These five factors decide how close you land.
1. Analyze Recent and Current Strategic Changes
Historical data is a strong baseline, but recent moves change the trajectory. New products, pricing changes, and promotions all shift the forecast. Bundling can lift acquisition, while a price increase can raise lifetime value. Account for these before you trust the trend line.
2. Use Your Sales Pipeline
Your sales pipeline is the most reliable signal for how many customers you will add. Pull projections from your quote-to-cash process and weight them by stage. A healthy pipeline read keeps the "new customers" line honest.
3. Analyze Customer Behavior
Churn and renewal rates vary across the customer lifecycle. Recent behavior is the best predictor of what comes next. If a customer has not logged in for a month, renewal is less likely. The cleanest way to read this is cohort analysis, powered by SaaS analytics that group customers by persona and lifespan.
4. Account for Expansion, Contraction, and Usage
Recurring revenue is not static. Upgrades, downgrades, and usage-based charges move the number every month. A forecast that only counts logos will miss the expansion and contraction that NRR captures. Model these flows explicitly, especially if you run hybrid or usage pricing.
5. Consolidate Across Entities and Currencies
Advanced B2B SaaS and fintech businesses rarely run on one entity or one currency. Multi-entity and multi-currency operations need clean consolidation before the forecast means anything. Pulling subscription billing data into a single system of record removes the guesswork in reconciliation that quietly distorts forecasts.
Also Read:
What Are the Common Pitfalls in Subscription Revenue Forecasting?
The common pitfalls in subscription revenue forecasting are over-relying on historical data, ignoring external market factors, neglecting seasonality and product lifecycle, and misusing or misreading metrics. Each one quietly skews the forecast.
When these traps appear, even a strong model fails. Here are four to avoid.
1. Overreliance on Historical Data
Past performance matters, but it should not be the whole forecast. The subscription model is dynamic, and market trends, competitor moves, and customer preferences shift fast. Update your forecast with current data so it reflects recognized revenue, not just last year's pattern.
2. Ignoring External Market Factors
Broader economic conditions, competitor actions, and industry shifts all skew a forecast. Review market trends regularly and fold the relevant signals into your assumptions. A forecast built in a vacuum rarely holds.
3. Neglecting Seasonality and Product Lifecycle Stages
Many subscription businesses see seasonal swings. Ignore them, and you get forecasts that are too optimistic or too pessimistic, plus cash flow surprises. Cohort analysis helps you spot seasonal patterns and build a steadier revenue picture.
4. Misinterpreting or Misusing Metrics
Metrics like growth rate, churn, and recognized revenue mislead when they are misread or misapplied. A common version of this is confusing billed or booked revenue with recognized revenue. Under ASC 606, revenue is recognized as it is earned, not when it is invoiced. A forecast built on bookings can overstate the period. Keep finance, sales, and customer success aligned on definitions so everyone forecasts from the same numbers.
How to Choose the Right Forecasting Approach and Tools
The right forecasting approach matches the model to your stage and contract complexity. Pick tooling on data quality, revenue-recognition rigor, and multi-entity support, since the best fit is the one your data can actually sustain, not the one with the most dashboards.
Five criteria separate a forecast you can defend from one you cannot:
- Match the model to your stage. Early teams lean top-down; operating teams need bottom-up or driver-based rigor.
- Data quality and granularity. Contract-level data beats aggregate spreadsheets every time.
- Revenue-recognition rigor. Can the tool generate ASC 606 / IFRS 15-ready numbers from the same data?
- Native subscription billing and CPQ. Built-in billing and quoting beat fragile integrations that break first.
- Multi-entity and multi-currency support. For global B2B SaaS and fintech, native consolidation is the line between "fit" and "outgrew."
This is where subscription management software earns its place. A platform with built-in revenue forecasting and analytics keeps your subscription, billing, and contract data in one place. Every model then runs on numbers you can trust. Younium is a subscription management platform that centralizes subscription, billing, and contract data and reports MRR, ARR, NRR, and churn, so finance teams can forecast from one current data set.
Curious how this looks against your own numbers? Explore Younium.
Also Read:
- From CRM to Revenue Management: Salesforce vs. Younium for B2B SaaS
- Best SaaS Billing Platforms You Can Explore
Wrapping Up
Forecasting subscription revenue comes down to three things: the right model, the metrics that feed it, and clean data underneath. Choose a model that matches your stage. Track MRR, ARR, NRR, churn, ARPA, and CLV. Then watch for the factors and pitfalls that quietly skew the number.
Do that consistently and your forecast becomes a number you can plan and raise against. Want to move beyond spreadsheets? Explore how subscription management and forecasting analytics in Younium keep your numbers current. Or request a demo to see it on your data.
FAQ
1. What is subscription revenue?
Subscription revenue is the recurring income a business earns from customers who pay a regular fee, monthly or annually. Because the fee repeats over a defined period, subscription revenue provides predictable, ongoing cash inflows. That predictability makes it a core metric for SaaS and subscription businesses planning growth and forecasting revenue.
2. How do you calculate a subscription revenue forecast?
A simple forecast multiplies your expected customer base by your average revenue per customer. The formula: (customers at period start + new customers − churned customers + expansion) × subscription fee.
For more accuracy, refine it with churn, expansion, downgrades, and usage charges. Most teams use a bottom-up model, adjusting for new logos, churn, and expansion each month.
3. What's the difference between top-down and bottom-up forecasting?
Top-down forecasting starts with the total market and assumes a share you can win. It suits board narratives and new markets. Bottom-up forecasting builds from your actual customer base, ARPA, churn, and pipeline, which suits operating plans. Bottom-up is usually more accurate because it builds on real subscription data. Top-down is faster but easier to inflate.
4. How do you forecast churn for a subscription business?
Start with your historical churn rate, then adjust for forward signals like product usage, support trends, and contract renewals. Cohort analysis sharpens it by grouping customers by signup date and lifecycle stage, since churn is rarely flat.
A SaaS analytics platform helps by identifying at-risk accounts using usage, engagement, and historical patterns, so your churn assumption reflects current behavior more accurately.
5. What is a good net revenue retention (NRR) rate?
For private B2B SaaS, a median NRR sits around 102%, per SaaS Capital's 2025 research, with top-quartile companies near 111%. Anything above 100% means your existing base grows through expansion even before new sales. NRR above 110% is a strong indicator of efficient expansion and is often seen in faster-growing SaaS companies.
6. Is subscription revenue an asset?
Subscription revenue is income, not an asset, but unearned subscription revenue can appear on the balance sheet. When a customer pays in advance, that amount is recorded as deferred revenue, a liability, until you earn it. Once you deliver the service and recognize the revenue, it moves to the income statement. So the cash is an asset; the obligation is a liability.
7. How should subscription revenue be recognized?
Subscription revenue should be recognized on an accrual basis, as it is earned, rather than when cash is received. Under ASC 606 and IFRS 15, you recognize revenue over the service period the customer pays for. An annual plan billed upfront is recognized monthly across the year. This keeps your recognized revenue accurate and compliant under ASC 606 and IFRS 15, which improves the reliability of any forecast built on it.
8. How far ahead should you forecast subscription revenue?
Most teams forecast 12 months ahead for operating plans and 3 to 5 years for fundraising or board models. The near-term forecast should be detailed and updated monthly. The long-term view is directional and built on growth and retention assumptions. The further out you go, the more your forecast depends on NRR and churn, so revisit those inputs often.
9. Which forecasting model is most accurate for SaaS?
For most SaaS businesses, a bottom-up model is most accurate, because it builds from real customer, ARPA, and churn data. Cohort-based forecasting adds precision when churn varies across the lifecycle or when you run usage-based pricing. Top-down has its place for early-stage or new-market estimates, but it should never be your only model.
10. What software helps forecast subscription revenue?
Accurate forecasting needs real-time access to subscription, billing, and customer data in one place. A subscription management platform like Younium centralizes that data and tracks MRR, ARR, NRR, and churn automatically.
With built-in analytics and revenue recognition, it lets finance teams build forecasts without manual reconciliation. They update as contracts change.
11. How is forecasting subscription revenue different from a one-time sales model?
A one-time sale is forecast deal by deal: once it closes, it's done. Subscription revenue forecasting has to account for what happens after the sale too: renewals, expansion, contraction, and churn, all recurring every billing period. That's why subscription forecasts lean on retention and cohort metrics that a one-time sales forecast never needs.