Net recurring revenue measures the revenue you keep and grow from existing customers. Get the NRR formula, a worked example, and fresh 2026 SaaS benchmarks.

Jump to read
What Is Net Recurring Revenue?
How Do You Calculate Net Recurring Revenue?
Gross vs Net Revenue Retention
What Is a Good Net Revenue Retention Rate?
Why Net Recurring Revenue Matters for Growth and Valuation
How Do You Improve Net Recurring Revenue?
Why Is NRR Harder to Track in B2B SaaS?
FAQs
Conclusion
|
Quick summary. Net recurring revenue is the share of recurring revenue you keep and grow from existing customers, expressed as net revenue retention (NRR). This guide gives you the definition, both the dollar and percentage formulas, a worked example, how NRR differs from gross revenue retention, current 2026 benchmarks by company size, and the levers that move the number. |
Net recurring revenue (NRR) is the percentage of recurring revenue you keep from existing customers over a set period after accounting for expansion, contraction, and churn. Most teams use it interchangeably with net revenue retention. An NRR above 100% means your customer base is growing on its own, before a single new logo signs.
That single number tells a finance team more about durability than almost any other metric. According to SaaS Capital’s 2026 survey of more than 1,000 private SaaS companies, the median private B2B business runs net recurring revenue of about 103%, while the strongest quartile clears 117%. The teams we work with treat that figure as the heartbeat of the subscription model: it shows whether the base you already won is quietly compounding or slowly leaking.
This guide is written for the people who own that number day to day, namely SaaS finance and RevOps teams, customer success leaders, and the investors and boards who read the result. It is pitched at an intermediate level, so we define each term once, show the maths, and keep the examples grounded in B2B contracts rather than self-serve sign-ups.
|
Net recurring revenue is the percentage of recurring revenue you keep and grow from existing customers, expressed as net revenue retention (NRR). This guide gives you the definition, both the dollar and percentage formulas, a worked example, how NRR differs from gross revenue retention, current 2026 benchmarks by company size, and the levers that move the number. |
What Is Net Recurring Revenue?
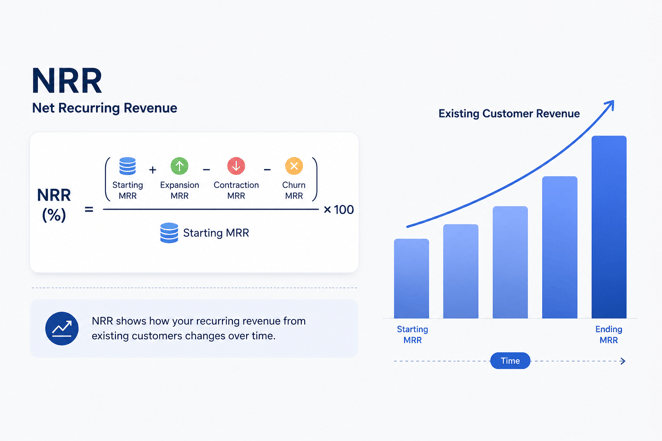
Net recurring revenue is the percentage of recurring revenue retained from your existing customer base over a period, after expansion, contraction, and churn. Reported as a percentage, it is the same metric the industry calls net revenue retention (NRR). A result above 100% means expansion has outpaced the revenue you lost.
Net recurring revenue answers a deceptively simple question: of the recurring revenue you started the period with, how much is left once you account for what customers added, cut, and canceled? It deliberately ignores revenue from brand-new customers, so it isolates the health of the base you have already won.
That focus is what separates it from raw recurring revenue building blocks like MRR and ARR. Monthly and annual recurring revenue measure the size of your subscription base. Net recurring revenue measures its quality: whether existing customers expand faster than they contract. A business can grow total ARR while its retention quietly weakens, and NRR helps expose that gap.
For B2B SaaS specifically, the metric carries extra weight. Expansion through seats, usage tiers and add-ons is often where the economics are won, and clean subscription reporting fundamentals make that expansion visible. Where billing data is messy, NRR becomes difficult to measure accurately. Where SaaS billing works cleanly, and a real-time metrics dashboard feeds off it, NRR becomes a reliable decision-making metric.
Net Recurring Revenue vs Net Revenue Retention: What’s the Difference?
Here is the distinction that trips up most readers: net recurring revenue is sometimes a dollar amount and sometimes a percentage, depending on who is using it. As a percentage it is net revenue retention. As a dollar figure, it is the recurring revenue your base produces after expansion and losses. The benchmarks and “good rate” figures most teams search for only make sense in the percentage reading, so that is what we lead with.
The confusion is everywhere, including in vendor URLs and headlines that say “recurring revenue” while the content describes retention. A third term, net new ARR, adds to the muddle because it does count new-customer revenue. The table below separates all three.
|
Metric |
What it measures |
Unit |
Short formula |
Counts new customers? |
|
Net revenue retention (NRR) |
Quality of the existing base |
Percentage |
(Start + expansion − contraction − churn) ÷ start |
No |
|
Net recurring revenue |
Recurring revenue from the existing base |
Dollar amount |
Start + expansion − contraction − churn |
No |
|
Net new ARR |
Total ARR added in a period |
Dollar amount |
New + expansion − contraction − churn |
Yes |
Keep the units straight, and the rest of this guide stays simple. When we say NRR should sit above 100%, we mean the percentage reading.
NRR, NDR and Net Dollar Retention: One Metric, Many Names
Net revenue retention travels under several names, and public companies rarely agree on the label. You will even see “net recurring revenue retention” used as a catch-all for the same percentage. The metric is the same; only the wording shifts.
- Net dollar retention (NDR) is the most common alternative. monday.com reports its result as NDR.
- Net MRR retention or net ARR retention appears in monthly and annual cohort reporting.
- Net ARR expansion rate is MongoDB’s chosen term for the same idea.
- Dollar-based net retention shows up in filings from companies such as CrowdStrike.
|
The practical takeaway: before you compare your number to anyone else’s, check how they defined it. A monthly figure and a trailing-twelve-month figure are not the same measurement, and the essential subscription KPIs behind each can differ. |
Also read:
- Subscription Metrics: Recurring Revenue in B2B
- Subscription Metrics Part 2: Difference between MRR & CMRR?
How Do You Calculate Net Recurring Revenue?
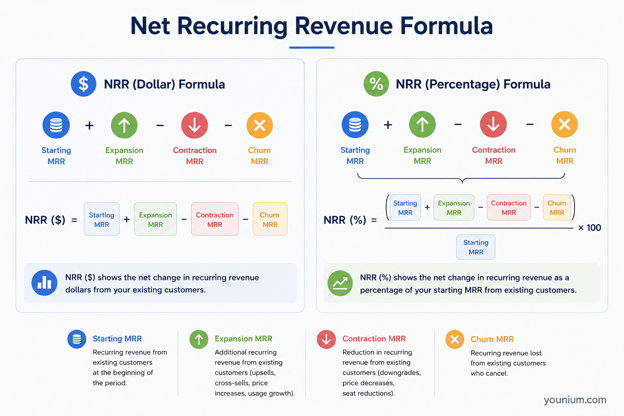
To calculate net recurring revenue, take your starting recurring revenue, add expansion, then subtract contraction and churn. Divide by the starting figure and multiply by 100 to express it as net revenue retention. The same four inputs produce both the dollar amount and the percentage.
Every version of the calculation leans on the same four inputs, measured across one period (a month, a quarter or a year):
- Starting recurring revenue is the MRR or ARR from existing customers at the start of the period.
- Expansion is revenue gained from those customers through upgrades, extra seats, higher usage tiers and add-ons.
- Contraction is revenue lost to downgrades and reduced usage, without the customer leaving.
- Churn is recurring revenue lost when customers cancel outright.
One point worth clarifying before we go further: ARR stands for annual recurring revenue, not “average” recurring revenue. It is simply MRR annualized, and you can use either MRR or ARR in the formulas below as long as you stay consistent. For a refresher on predicting future revenue streams, these same inputs feed the forecast.
The Net Recurring Revenue Formula (Dollar Amount)
To find net recurring revenue as a dollar figure, add expansion to your starting recurring revenue, then subtract contraction and churn. The result is the recurring revenue your existing base produces by the end of the period.
Net recurring revenue = Starting MRR + Expansion MRR − Contraction MRR − Churned MRR
This version is useful for cash and subscription revenue model template work, where you care about the actual currency figure. It cannot, however, be compared against an industry “good rate” because a dollar amount has no ceiling to measure against. For that, you need the percentage.
The Net Revenue Retention Formula (Percentage)
To express the same idea as net revenue retention, divide the net recurring revenue figure by your starting recurring revenue, then multiply by 100.
NRR (%) = (Starting MRR + Expansion − Contraction − Churn) ÷ Starting MRR × 100
The percentage is what boards, investors and the SaaS analytics tools report, because it is comparable across companies of any size. One detail heavily influences the result: the measurement window.
A monthly snapshot smooths out lumpy contracts, while a trailing-twelve-month view is the standard for board reporting. monday.com, for instance, publishes a trailing-four-quarter weighted average, and clearly defining your measurement window improves comparability.
Worked Example: One Cohort, Three Metrics
The fastest way to make this concrete is to run one cohort through all three numbers. Imagine a B2B SaaS business that begins the year with a defined group of customers and watches what they do over twelve months.
- Start with $100,000 in monthly recurring revenue from existing customers.
- Add $12,000 of expansion from upgrades and extra seats, taking the base to $112,000.
- Subtract $3,000 of contraction from downgrades, leaving $109,000.
- Subtract $5,000 of churn from cancellations, leaving $104,000.
From that single cohort, three metrics fall out:
|
Metric |
Calculation |
Result |
|
Net recurring revenue ($) |
100,000 + 12,000 − 3,000 − 5,000 |
$104,000 |
|
Net revenue retention (NRR) |
104,000 ÷ 100,000 × 100 |
104% |
|
Gross revenue retention (GRR) |
(100,000 − 3,000 − 5,000) ÷ 100,000 × 100 |
92% |
|
The spread between 104% and 92% is the part a CFO should read closely. The 92% GRR says the base would have shrunk by 8% on its own; the 104% NRR says expansion more than covered the loss and grew the cohort. Same customers, same period, two very different stories, and you need both to know whether growth is healthy or simply masking churn. |
Also read:
- Forecasting Subscription Revenue: How to Do It Right
- What Is CPQ? A Complete Guide for Subscription Businesses
Gross vs Net Revenue Retention: What Each Metric Tells You
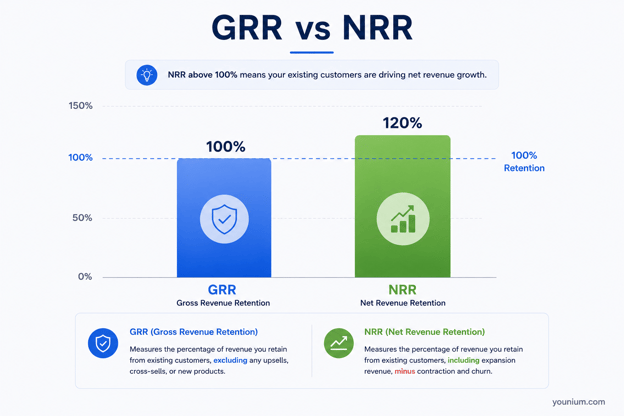
Gross revenue retention strips out every dollar of expansion and asks only how much of your starting revenue survived contraction and churn. It provides a baseline view of retention.
The cleanest way to hold the two apart: GRR caps at 100% and NRR can exceed it. Gross revenue retention strips out every dollar of expansion and asks only how much of your starting revenue survived contraction and churn. It is the honest floor. Net revenue retention then credits expansion, which is why a strong B2B business can post NRR well above 100% while its GRR sits in the low 90s.
The two answer different questions, and you report them to different audiences.
|
Dimension |
Gross revenue retention (GRR) |
Net revenue retention (NRR) |
|
What it includes |
Contraction and churn only |
Contraction, churn and expansion |
|
Ceiling |
Caps at 100% |
Can exceed 100% |
|
Question it answers |
How leaky is the base? |
Does the base compound? |
|
Who watches it most |
Customer success, risk, auditors |
Investors, boards, the CEO |
|
Typical B2B median (2026) |
~91% |
~103% |
Those medians come from SaaS Capital’s 2026 benchmarking survey, which put bootstrapped private SaaS at roughly 91% gross and 103% net retention. The gap between the two, about 12 points, is the expansion engine doing its work. KeyBanc and Sapphire Ventures’ 16th annual survey of private SaaS companies tells a similar story on the gross side. It found that gross retention slipped to 86% in 2023, and expects a climb back toward the 90% mark.
|
A practical rule for B2B teams: protect GRR first, then build NRR. Expansion cannot rescue a product that does not retain, so plugging revenue leakage gaps and tracking the SaaS churn rate benchmarks that feed contraction come before any upsell motion. Once the floor is solid, revenue efficiency metrics and disciplined subscription lifecycle management turn retention into compounding growth. |
Also read:
- What is a Good Churn Rate for SaaS Companies? Benchmarks
- SaaS Subscription Pricing Strategies for Customer Success
What Is a Good Net Revenue Retention Rate?
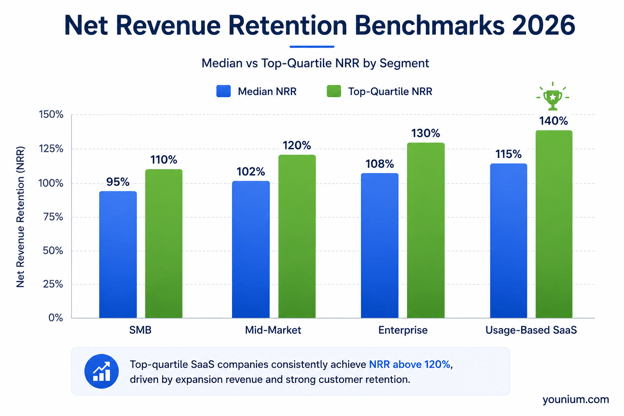
A good net revenue retention rate sits above 100%. For private B2B SaaS the 2026 median is roughly 102–103%, the top quartile reaches 111–120% depending on segment, and 120% or higher marks the leading tier. Benchmarks shift with company size, contract value and pricing model, so compare like with like.
The headline is simple: above 100% is healthy, because it means expansion has outpaced losses. The detail is where the real benchmarking value sits. Below are the numbers a finance team can actually benchmark against, drawn only from primary surveys and company filings.
Private SaaS sits closer to the 100% line than the public-company headlines suggest. According to SaaS Capital’s 2026 survey, the median private B2B SaaS business runs NRR near 103%, with the top quartile around 117%. Its 2025 retention study put median NRR at 102% for companies with $25,000–$50,000 contracts, and found that higher contract values track with higher retention.
|
Segment |
Median NRR |
Top quartile |
Source (year) |
|
Bootstrapped private B2B SaaS ($3–20M ARR) |
103% |
~117% (90th pct: 117.9%) |
SaaS Capital (2026) |
|
Private SaaS, $25–50K contracts |
102% |
111% |
SaaS Capital (2025) |
|
Private SaaS by ARR band, top quartile NDR |
— |
~120% (114–124% across bands) |
ICONIQ (2025) |
|
Top quartile, usage-based pricing |
— |
135% |
ICONIQ (2025) |
|
Top quartile, subscription pricing |
— |
121% |
ICONIQ (2025) |
Note: NDR (Net Dollar Retention) is another term for NRR
Public companies set the ceiling, and their filings show what scaled expansion looks like. The most recent reported figures cluster well above the private median.
|
Company |
Reported metric |
Latest figure |
Period |
|
Snowflake |
Net revenue retention |
126% |
Q1 FY2027 (Apr 2026) |
|
MongoDB |
Net ARR expansion rate |
121% |
Q1 FY2027 (May 2026) |
|
Datadog |
Trailing-12-month NRR |
low 120s% |
Q1 2026 |
|
CrowdStrike |
Dollar-based net retention / gross |
115% / 97% |
Q4 FY2026 (Jan 2026) |
|
monday.com |
Net dollar retention (110% overall) |
116% for $50K+ ARR |
Q1 2026 |
Figures from each company’s most recent earnings release: Snowflake, MongoDB, Datadog, CrowdStrike and monday.com.
Two cautions keep these benchmarks honest. First, retention has compressed since the 2021 peak. ICONIQ’s data shows top-quartile net dollar retention for companies under $100M ARR falling from about 128% before 2020 to 113% in 2024, then recovering toward 121% in 2025. The bar for “good” is lower than the numbers founders memorised four years ago.
Second, the panel matters enormously. ICONIQ describes healthy net dollar retention as “settling into a healthy ~110–120% range” for its venture-scale portfolio. ChartMogul’s 2025 retention report, which leans toward smaller and self-serve businesses, found a median B2B SaaS NRR closer to 82%. Neither is wrong; they measure different populations. Benchmark yourself against companies of your size, contract value and motion, not against the public-company headlines.
For the wider context these benchmarks sit within, our roundup of key SaaS metrics to track and Ben Murray’s SaaS metrics insights place NRR alongside the efficiency and growth measures boards read together. Retention quality also feeds directly into company valuation, cash flow performance, and the broader SaaS finance trends shaping 2026.
Also read:
- What Is Revenue Leakage and How to Prevent It
- How to Ace Subscription Management and Revenue Forecasting
Why Does Net Recurring Revenue Matter for Growth and Valuation?
Net recurring revenue matters because it compounds. A company holding 120% NRR roughly doubles its existing-customer revenue every four years without winning a single new account, which is why investors treat the metric as a proxy for growth durability and often value it highly.
Net recurring revenue earns its status for three reasons: it predicts growth, it drives valuation, and it reveals the quality of customer success. Each one matters more in 2026 than it did during the cheap-capital years, because efficient, retention-led growth is now the scarce asset.
One of the strongest links is growth. SaaS Capital’s 2025 analysis found a strong, near-exponential correlation between retention and growth: cohorts with NRR of at least 110% grew faster than the population median, while those below 100% grew slower. Retention is not a lagging report card; it is a leading indicator of next year’s growth rate.
The valuation link follows directly. SaaS Capital treats net revenue retention as one of three variables in its private-company valuation framework, alongside growth and public multiples. That weighting matters most in a down market. With SaaS valuations hitting decade-plus lows in early 2026, buyers are paying up for the predictable expansion that high NRR represents, and discounting almost everything else. During due diligence, retention quality is often one of the most closely scrutinized metrics.
The third reason is structural, and it sharpens as you scale. ICONIQ’s 2025 data shows expansion’s share of new ARR climbing from about 24% at companies under $10M ARR to roughly 66% at companies above $500M. New logos drive growth early, but past about $200M ARR, expansion from the existing base becomes the main engine. High Alpha’s 2025 benchmarks make the same point from the efficiency angle: businesses pairing high NRR with fast CAC payback grew about 71% on average, far ahead of their low-retention peers. Strong revenue growth management levers and disciplined SaaS revenue recognition standards are what let that expansion show up cleanly in the numbers.
How Do You Improve Net Recurring Revenue?
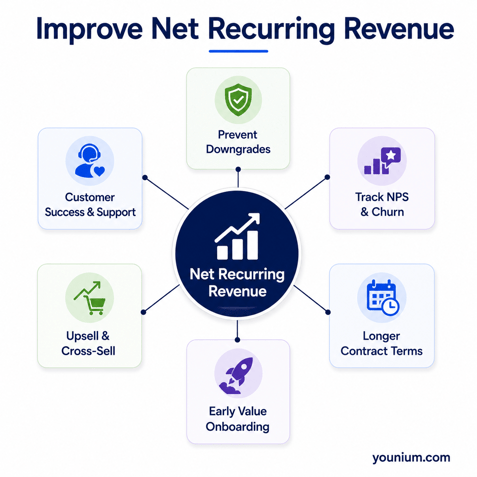
You improve net recurring revenue by lifting expansion and cutting contraction and churn. The six levers below, from customer success and onboarding to pricing and contract length, move different parts of the equation, so the strongest programmes work several at once rather than chasing a single tactic.
There is no single switch for NRR. The number is the net result of many customer decisions, so the teams that move it treat improvement as a portfolio of levers rather than one campaign. Six matter most.
Strengthen Customer Success and Support
Retention starts with whether customers reach the outcome they bought. A dedicated customer success function, working closely with support and product, catches risk early and turns reactive tickets into proactive guidance. Align the team around adoption milestones, not ticket volume, and connect support insight back to product so recurring friction gets fixed. Strong customer retention tactics protect both halves of the metric: they cut churn and they open the door to expansion.
Diagnose and Prevent Downgrades
Contraction is quieter than churn and often more fixable. Downgrades often cluster around a few recurring causes rather than occurring at random. When a customer downgrades, treat it as a signal, not a closed ticket, and ask why: did the product underdeliver, did the buyer change, or was the original fit wrong? Reviewing your ideal customer profile against the accounts that contract most often usually explains the pattern. Catching the reasons behind downgrades, then acting on them before renewal, recovers revenue that would otherwise leak straight out of GRR.
Track NPS and Run Churn Surveys
You cannot improve what you cannot see coming. Net Promoter Score and structured churn surveys are leading indicators that flag dissatisfaction while there is still time to act. The point is not the score itself but the follow-up: route detractors to customer success, and feed cancellation reasons into a churn analysis loop that closes the gaps. A 60-to-90-day pre-renewal check-in helps turn these signals into retention opportunities.
Sharpen Upselling and Cross-Selling
Expansion is where NRR climbs above 100%, and it works best when it maps to value the customer already feels. Usage-based and tiered models make expansion natural, because revenue grows as the customer succeeds; ICONIQ’s data shows usage-based pricing posting markedly higher top-quartile retention than flat subscriptions. Time upsell prompts to adoption milestones rather than the calendar. Our guides to usage-based pricing models and usage pricing challenges cover where this helps and where it backfires.
Encourage Longer Contract Terms
Longer commitments stabilise the base and reduce the number of moments a customer can churn. Annual and multi-year terms, supported by sensible incentives, lock in revenue and give customer success more time to deliver value before a renewal decision. The trade-off is flexibility, so price the commitment fairly rather than trapping customers, and lean on solid pricing strategy to make the longer term attractive on its own merits.
Optimise Onboarding for Early Value
The first weeks decide the renewal. Onboarding that gets a customer to first measurable value quickly sets the tone for the entire relationship and is the cheapest retention investment you can make. Map the path to that first outcome, remove every avoidable step, and measure time-to-value as seriously as you measure acquisition. Pair it with a renewals motion built for the shifting renewals landscape and supported by tactics for improving renewal rates.
Also read:
- Essential Subscription Business Metrics to Track
- What is a Good Churn Rate for SaaS Companies? Benchmarks
Why Is NRR Harder to Track in B2B SaaS?
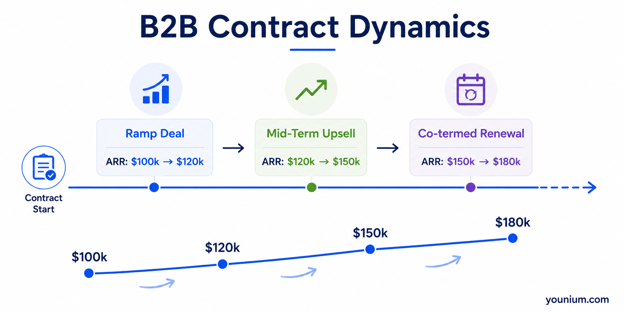
NRR is harder to track in B2B SaaS because contracts are not tidy monthly subscriptions. Ramp deals, co-terminated amendments, mid-term upsells and annual invoicing all distort which revenue counts as “starting”, “expansion” or “churn”, so the measurement window and clean contract data decide whether the number is trustworthy.
Self-serve businesses can read retention almost straight from their billing system. B2B SaaS rarely can, because the contracts carry complications that simple “starting MRR times growth” maths breaks on.
Multi-year ramp deals are the clearest example. When a contract steps up in year two by design, is that “expansion” or just the schedule you already signed? Co-terminated amendments, where a mid-term upsell is aligned to the original renewal date, blur the period boundaries further. Annual invoicing adds another wrinkle: a yearly cohort window and a monthly one can produce different NRR figures from the same customers. And usage-based components mean revenue can move every month without any contract change at all.
There is also an accounting boundary worth naming. Net recurring revenue is an operating metric built on bookings and ARR, not a figure recognised under accounting standards. Revenue you recognise under ASC 606 compliance can differ from the ARR you use for NRR, particularly where usage-based or milestone billing is involved, so the two should never be conflated in board reporting.
This is where tooling earns its place. Consistent NRR depends on contract-level data that knows the difference between a scheduled ramp and genuine expansion, and that keeps the measurement window stable from one quarter to the next. A subscription management platform such as Younium helps centralise contract and billing data, making retention metrics more consistent from one period to the next.The same clean data also improves revenue forecasting and broader subscription operations.
|
How to choose the way you track NRR. Weigh five criteria before settling on a method or tool:
|
For teams running this in spreadsheets today, our guides to automated subscription billing, the subscription management platform itself, and a metrics-first management approach show where automation removes the manual rebuilds.
FAQs
1. What is NRR in SaaS?
In SaaS, NRR (net revenue retention) is the percentage of recurring revenue retained from existing customers over a period, including expansion and after losses. It excludes new-customer revenue, so it isolates how well the current base holds and grows. A result above 100% means expansion outweighed contraction and churn.
2. Is net recurring revenue the same as net revenue retention?
Mostly, yes. Most teams use the two terms interchangeably for the percentage that shows how much recurring revenue you keep and grow from existing customers. Strictly, net recurring revenue can also mean a dollar amount, while net revenue retention is always the percentage version of that same calculation.
3. How do you calculate net revenue retention?
Take your starting recurring revenue, add expansion, then subtract contraction and churn. Divide that result by the starting figure and multiply by 100. So a base that starts at $100,000, gains $12,000, and loses $8,000 returns $104,000, or 104% net revenue retention for the period.
4. What is a good net revenue retention rate?
Above 100% is healthy, because the existing base is growing on its own. For private B2B SaaS the 2026 median sits near 103%, the top quartile typically falls between 111% and 120%, and 120% or higher marks the leading tier. Compare against companies of your size and contract value, not public-company headlines.
5. What is the difference between NRR and ARR?
ARR (annual recurring revenue) measures the size of your recurring revenue base. NRR measures its quality, namely how much of that base you retain and expand over time. ARR can rise while NRR falls if new customers mask churn, which is why finance teams read the two together.
6. Can net revenue retention be over 100%?
Yes. NRR exceeds 100% when expansion from existing customers, through upgrades, extra seats and higher usage, outweighs the revenue lost to downgrades and cancellations. This outcome is often referred to as negative revenue churn, and it lets a company grow recurring revenue from its current base before adding any new customers.
7. What is net new ARR?
Net new ARR, sometimes called net annual recurring revenue added, is the total annual recurring revenue gained in a period, including revenue from brand-new customers plus expansion, minus contraction and churn. It differs from NRR, which deliberately excludes new customers. Net new ARR measures total growth; NRR measures the health of the existing base only.
8. Does NRR include revenue from new customers?
No. Net revenue retention measures only the existing customer base, tracking expansion, contraction and churn within it. New-customer revenue is excluded by design. Counting new logos in the calculation is a common modelling error; that revenue belongs in net new ARR, not in your retention figure.
9. How often should you measure NRR?
Most teams track NRR monthly for operational signal and report a trailing-twelve-month figure to the board to smooth out lumpy contracts. The exact cadence matters less than consistency: pick one window, define it clearly, and measure it the same way every period so the trend is comparable.
10. What is the difference between MRR and ARR?
The MRR vs ARR distinction comes down to the period. MRR (monthly recurring revenue) and ARR (annual recurring revenue) measure the same base, with ARR broadly equal to MRR multiplied by twelve, adjusted for contract terms. Monthly businesses tend to lead with MRR; annual-contract B2B SaaS usually reports ARR. Both can be used in NRR calculations, provided you stay consistent.
Conclusion
Net recurring revenue is the clearest read you have on whether your subscription base is compounding or quietly leaking. Hold it above the break-even line and existing customers grow your revenue on their own; let it slip below, and new sales are simply refilling a bucket with a hole. The number rewards the unglamorous work: clean onboarding, fast time-to-value, fair contracts and expansion that tracks real customer success.
Getting it right starts with measuring it consistently, and that depends on contract and billing data you can trust. If you want to see how Younium tracks retention metrics from clean contract-level data, our team can walk you through it.
What is your team’s net recurring revenue telling you right now? Share your questions in the comments.